Usage Details
What is the Usage Dashboard?
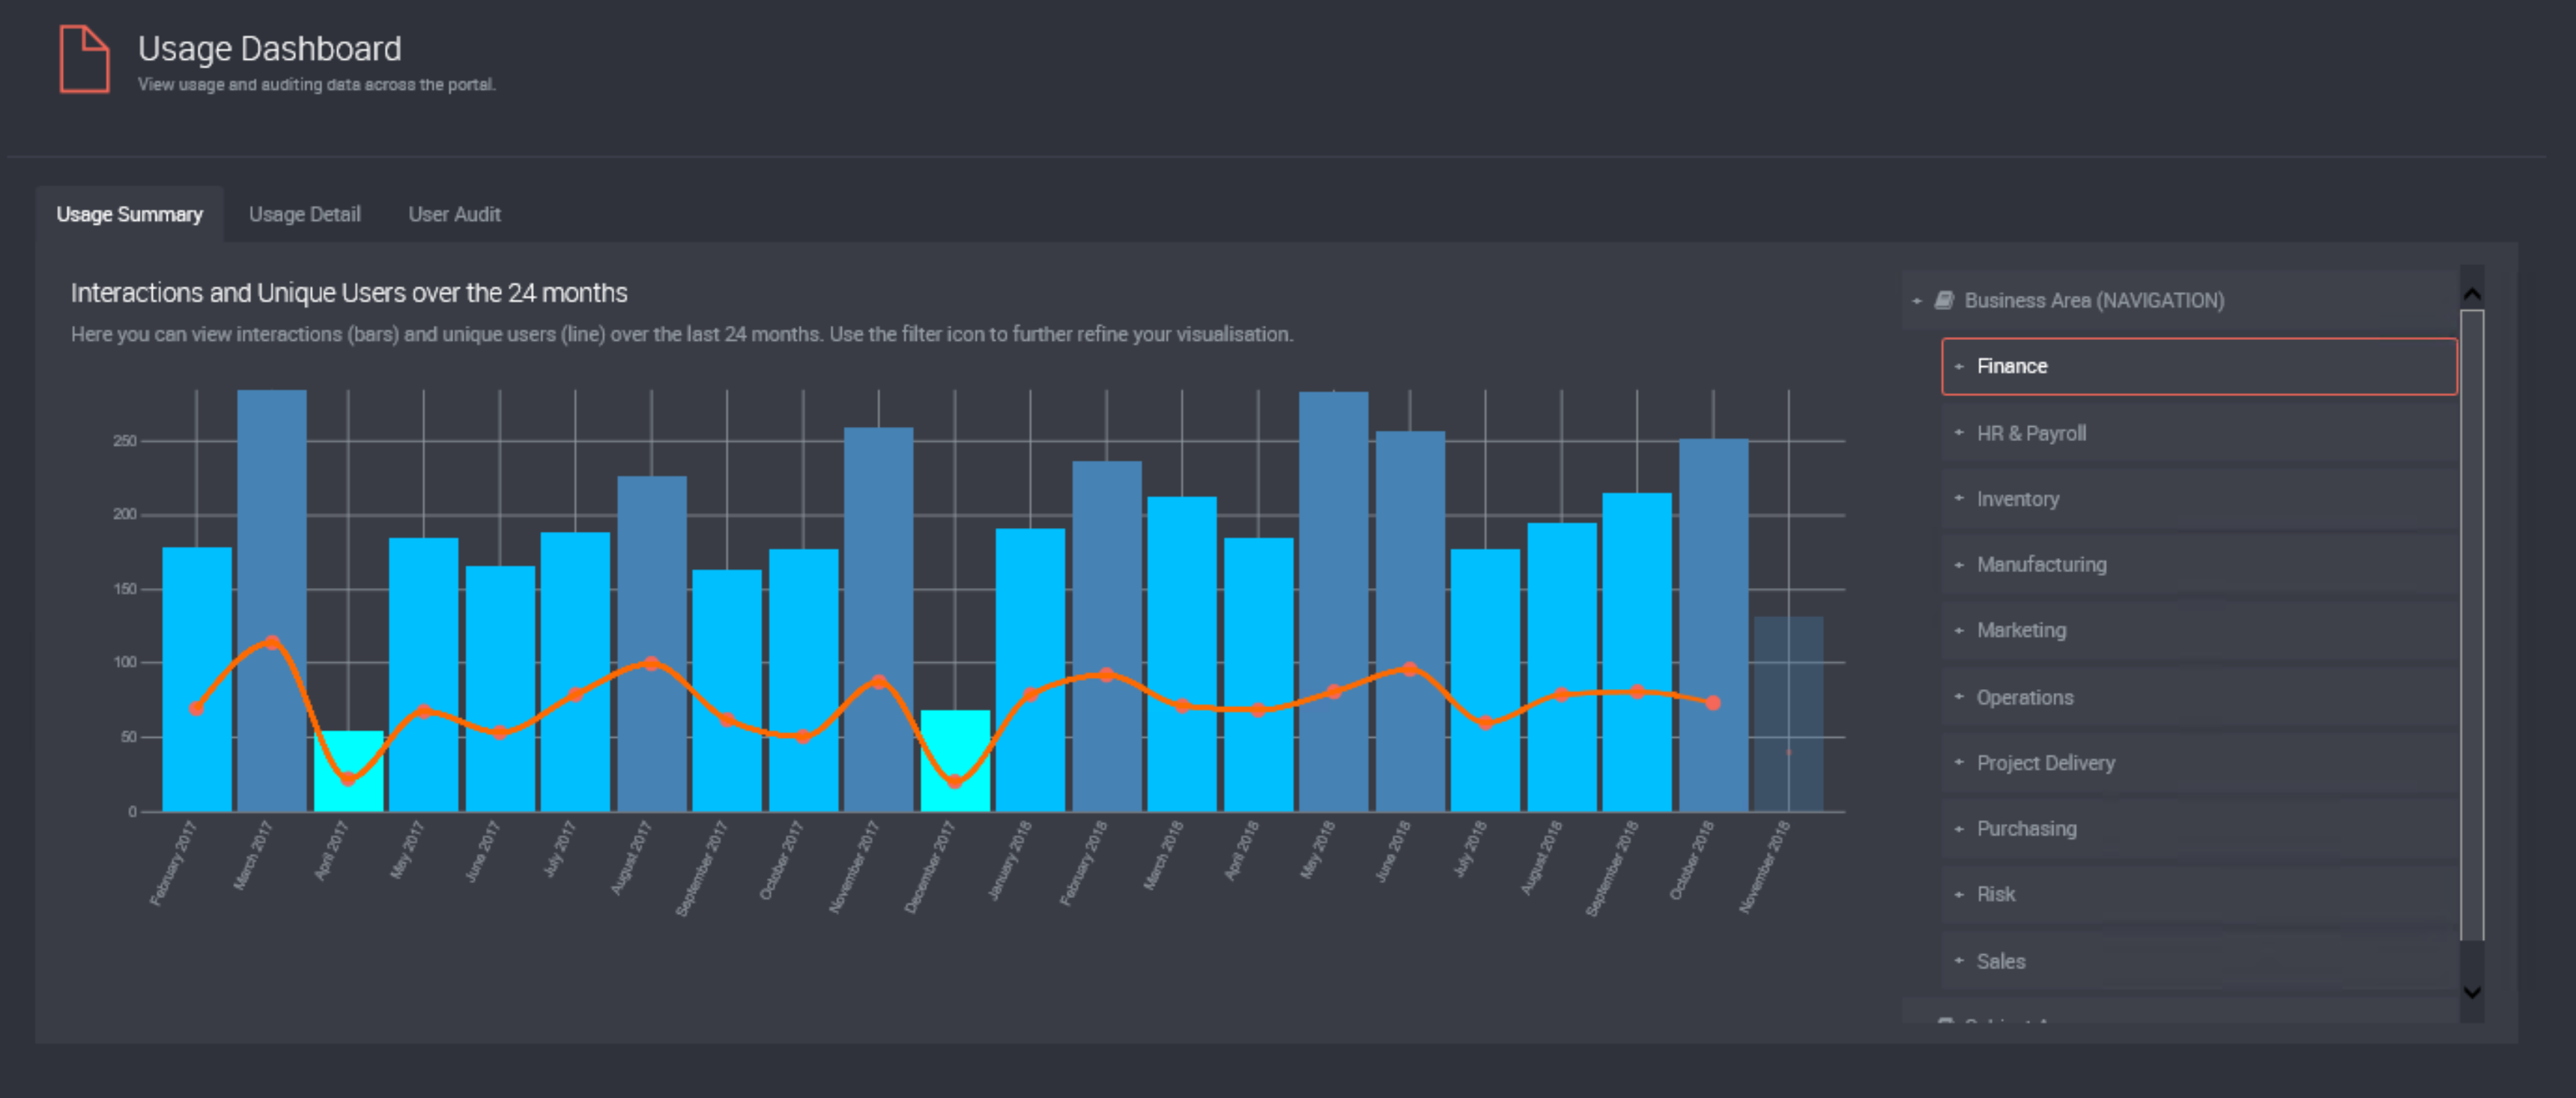
A Usage Dashboard provides interaction information on users and assets. It allows you to view the number of interactions and unique interactions for each month of the last 24 months. The information is presented in a user friendly line chart (number of unique interactions) and column chart (number of interactions) making it easier for you to see the trend of your business.
You will find the following tabs of information on the Usage Dashboard page and we will explain each tab below.
- Usage Summary
- Usage Detail
- User Audit
What sort of interactions are captured?
We log usage metrics such as asset information usage, discussion usage, when an asset is opened, the help desk ticket functions, tile layout usage, tile click usage and pinned asset usage.
How do I view the Usage Summary?
Click the Settings Cog Icon at the top right hand corner.
Select Usage Dashboard.
The default view will be on the Usage Summary tab.
Expand and drill through different terms to hone in on information from different areas of the business.
The current month will not be a solid colour on the graph as the usage for the current month may change. It will be an opaque colour once the month is over and usage numbers have finalised for that month.
How do I view detailed usage information for assets?
Click on the Usage Detail tab.
Here you can view all interactions related to the assets. You can use the filter to refine your results.
Use Show entries to select the number of entries to display.
Use Search by Asset Name to search for all interactions for a particular asset.
Use the arrows beside each column title to change whether it is sorted in descending or ascending order.
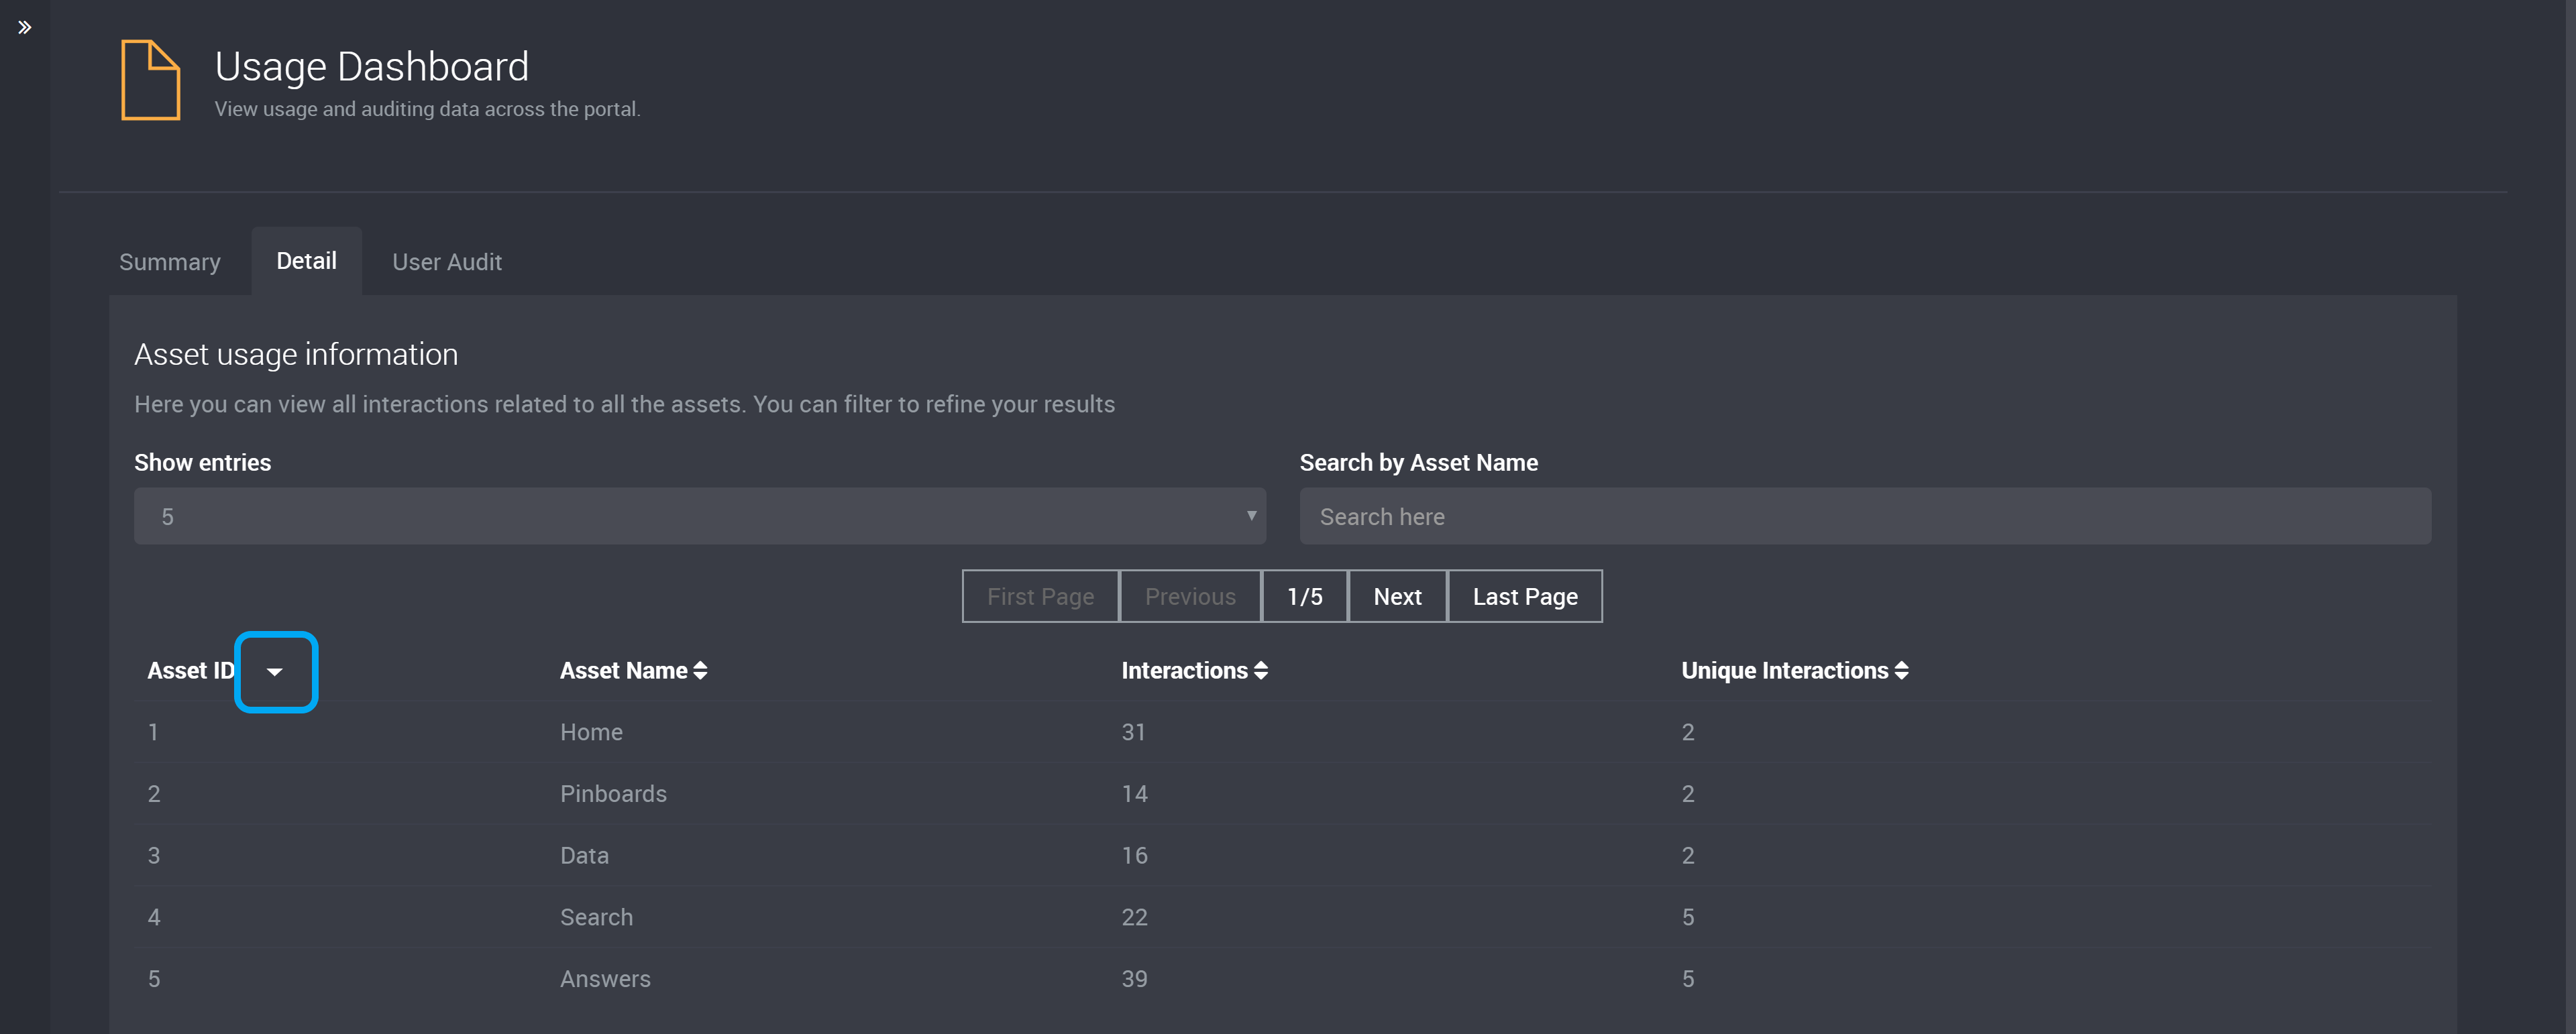
Details displayed:
- Asset ID
- Asset Name
- Interactions
- Unique Interactions
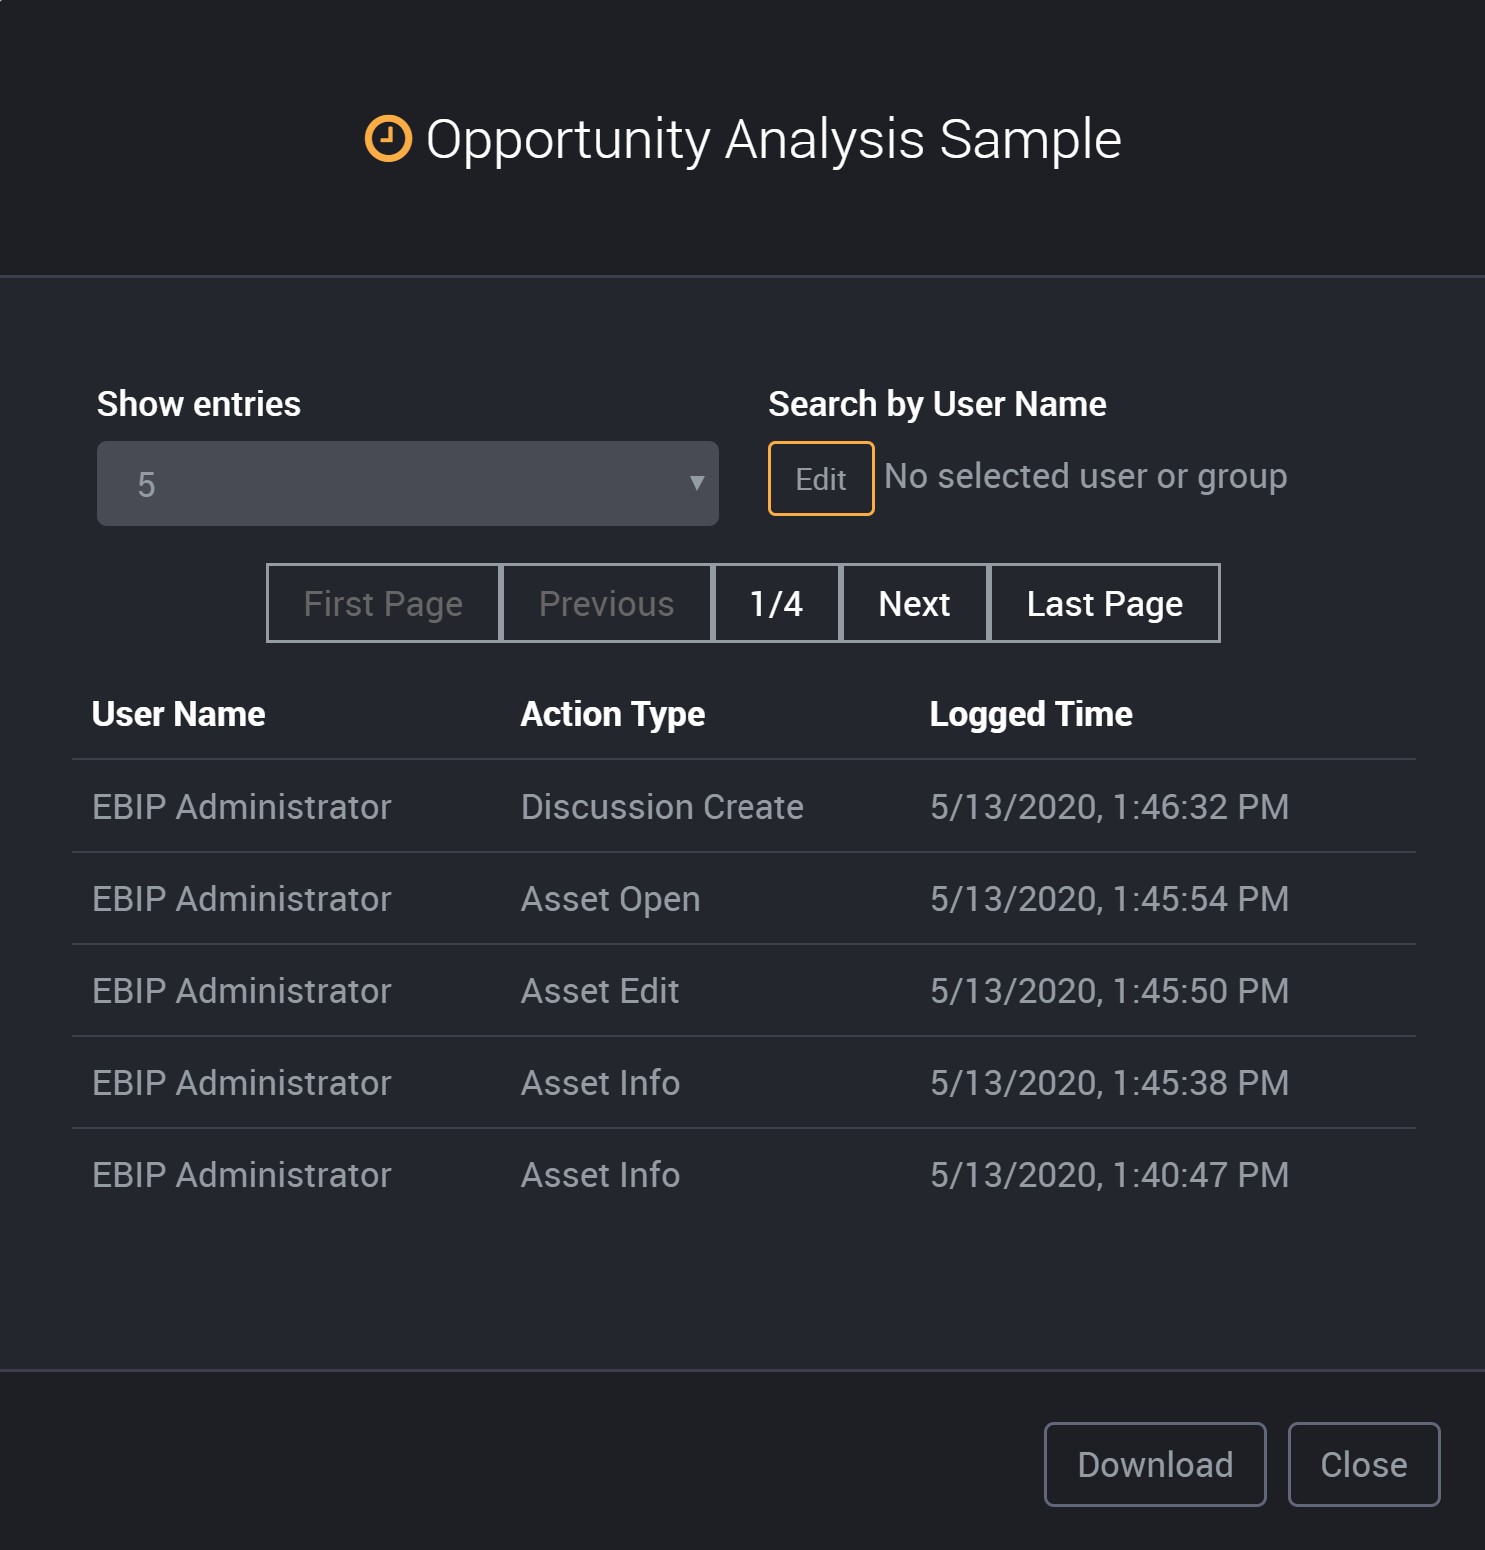
How do I view interactions for a particular user?
Click on the User Audit tab.
Here you can search by user and display all interactions for that user.
Click Edit to search for a user.
Start typing a name, and the user will appear in a drop down menu of suggestions.
Select the relevant user/group.
Click Close.
Use Show entries to select the number of entries to display.
Use Search by Asset Name to search for interactions for a particular asset filtered by the user above.
Here, you can also use the arrows beside each column title to change whether it is sorted in descending or ascending order.
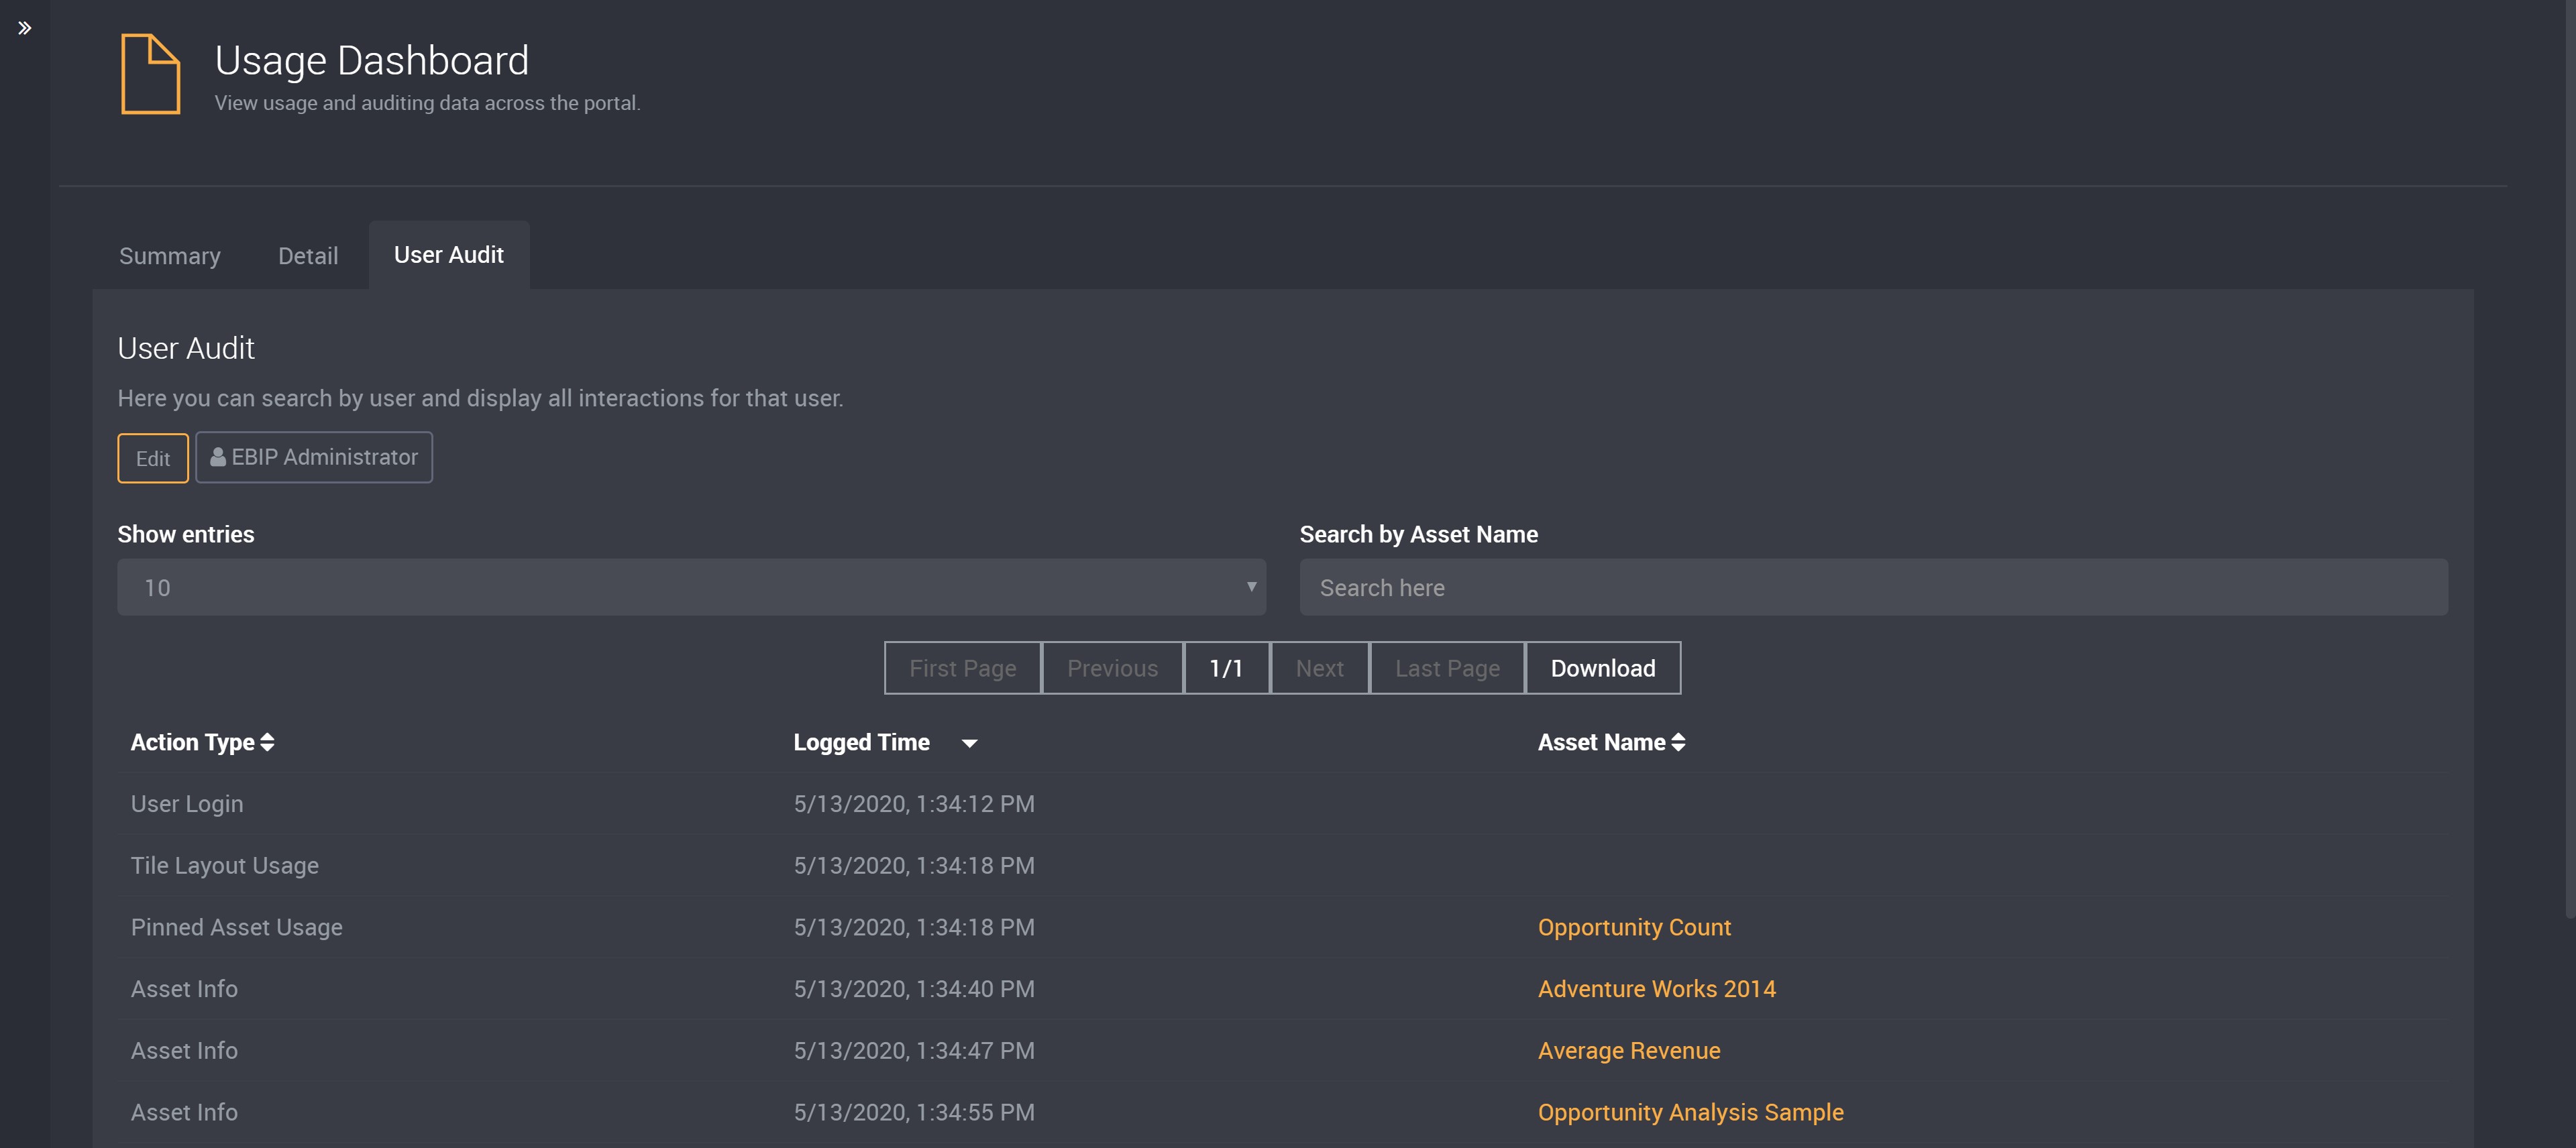
Details displayed:
- Action Type
- Logged Time
- Asset Name
Click the Edit button again to search for another user.
Can I view usage from the asset card itself?
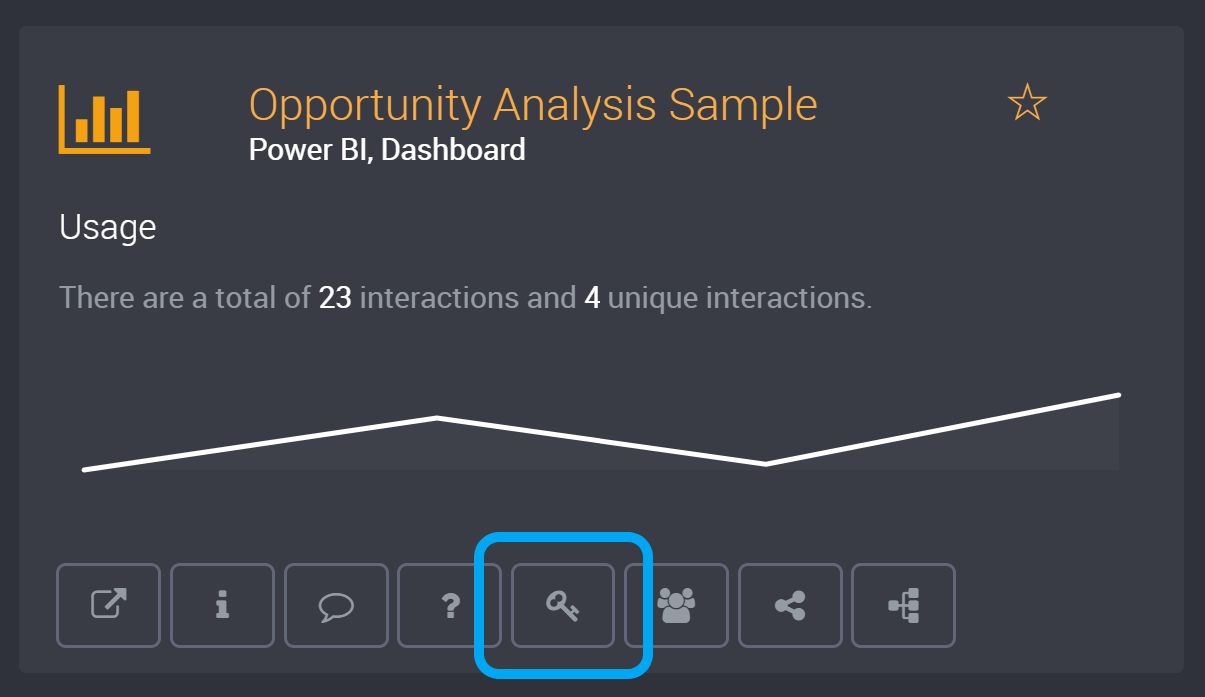
Yes! Another way of viewing asset usage is by clicking on the Usage button from the asset card. All user and usage details will be displayed for that particular asset.
You can search for activities from a specific user. Click Edit under ‘Search by User Name’.
Start by typing the user/group.
Select the user. All usage associated with that user will display.
Asset usage data can also be exported to a CSV file.
Click on the Download button to save a copy of the file.
How do I view usage on a Control Node?
In the Control Node, the Usage Dashboard displays individually for each Loome Publish instance.
You will have click on the Loome Publish instance from the navigation panel on the left and then click on the Usage Dashboard page from the settings dropdown. This will display the usage of your selected Loome Publish instance.